Code
options(repos = c(CRAN = "https://cloud.r-project.org"))This project uses a dataset provided by IBM’s Accelerator Catalog, which tracks customer churn for a fictional telecommunications company. The dataset is a combination of multiple files that include demographic information, geographic data, service usage details, customer satisfaction scores, and churn status. These data were generated to simulate realistic business scenarios, allowing for exploratory analysis and modeling. Each file is in CSV format, and data are structured with rows representing individual customers and columns capturing various attributes. The dataset is static, meaning it does not receive updates, and its dimensions vary across files, ranging from a few hundred to several thousand rows. Potential issues include missing values in certain columns and the presence of overlapping information across files, requiring careful merging and cleaning. Data were imported into R using the read_csv() function for initial inspection and processing. The dataset is publicly available via IBM’s Accelerator Catalog, which provides detailed documentation of its structure and purpose.
options(repos = c(CRAN = "https://cloud.r-project.org"))library(dplyr)
library(readr)
cc <- read_csv("data/CustomerChurn.csv")
demographics <- read_csv("data/Telco_customer_churn_demographics.csv")
location <- read_csv("data/Telco_customer_churn_location.csv")
population <- read_csv("data/Telco_customer_churn_population.csv")
services <- read_csv("data/Telco_customer_churn_services.csv")
status <- read_csv("data/Telco_customer_churn_status.csv")
merged_data <- cc %>%
left_join(demographics, by = "Customer ID") %>%
left_join(location, by = "Customer ID") %>%
left_join(services, by = "Customer ID") %>%
left_join(status, by = "Customer ID") %>%
left_join(population, by = "Zip Code")
saveRDS(merged_data, "merged_data.rds")install.packages("naniar")package 'naniar' successfully unpacked and MD5 sums checked
The downloaded binary packages are in
C:\Users\langs\AppData\Local\Temp\Rtmpeqjj01\downloaded_packageslibrary(naniar)
library(ggplot2)
library(dplyr)missing_plot <- gg_miss_var(merged_data) +
ggtitle("Missing Values by Variable") +
theme_minimal(base_size = 5) +
theme(
axis.text.y = element_text(size = 4),
axis.text.x = element_text(size = 6),
plot.title = element_text(hjust = 0.5, size = 9)
) +
labs(x = "Variables", y = "# Missing")
print(missing_plot)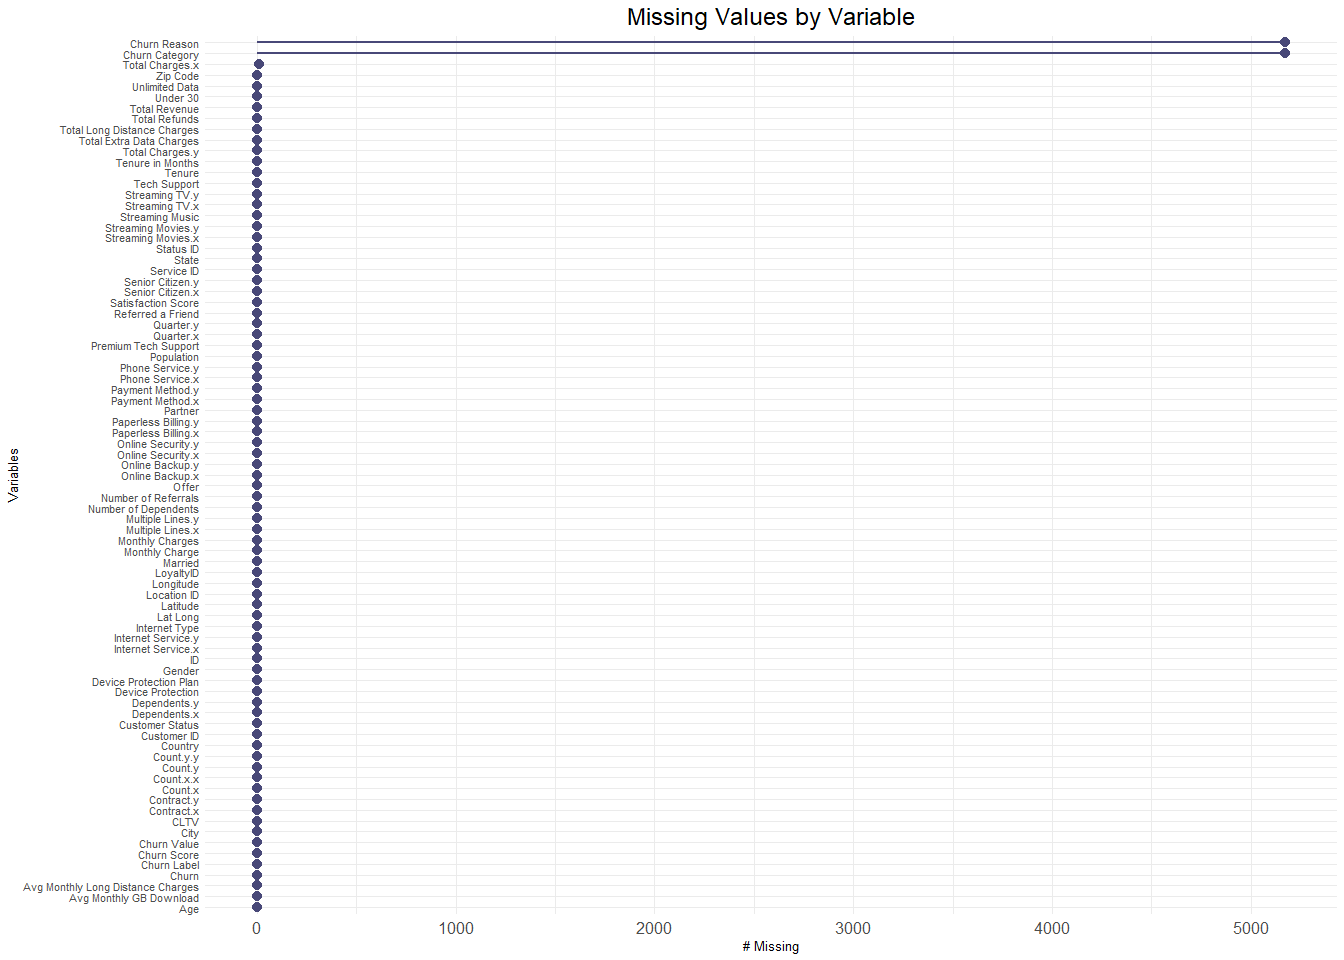
gg_miss_upset(merged_data)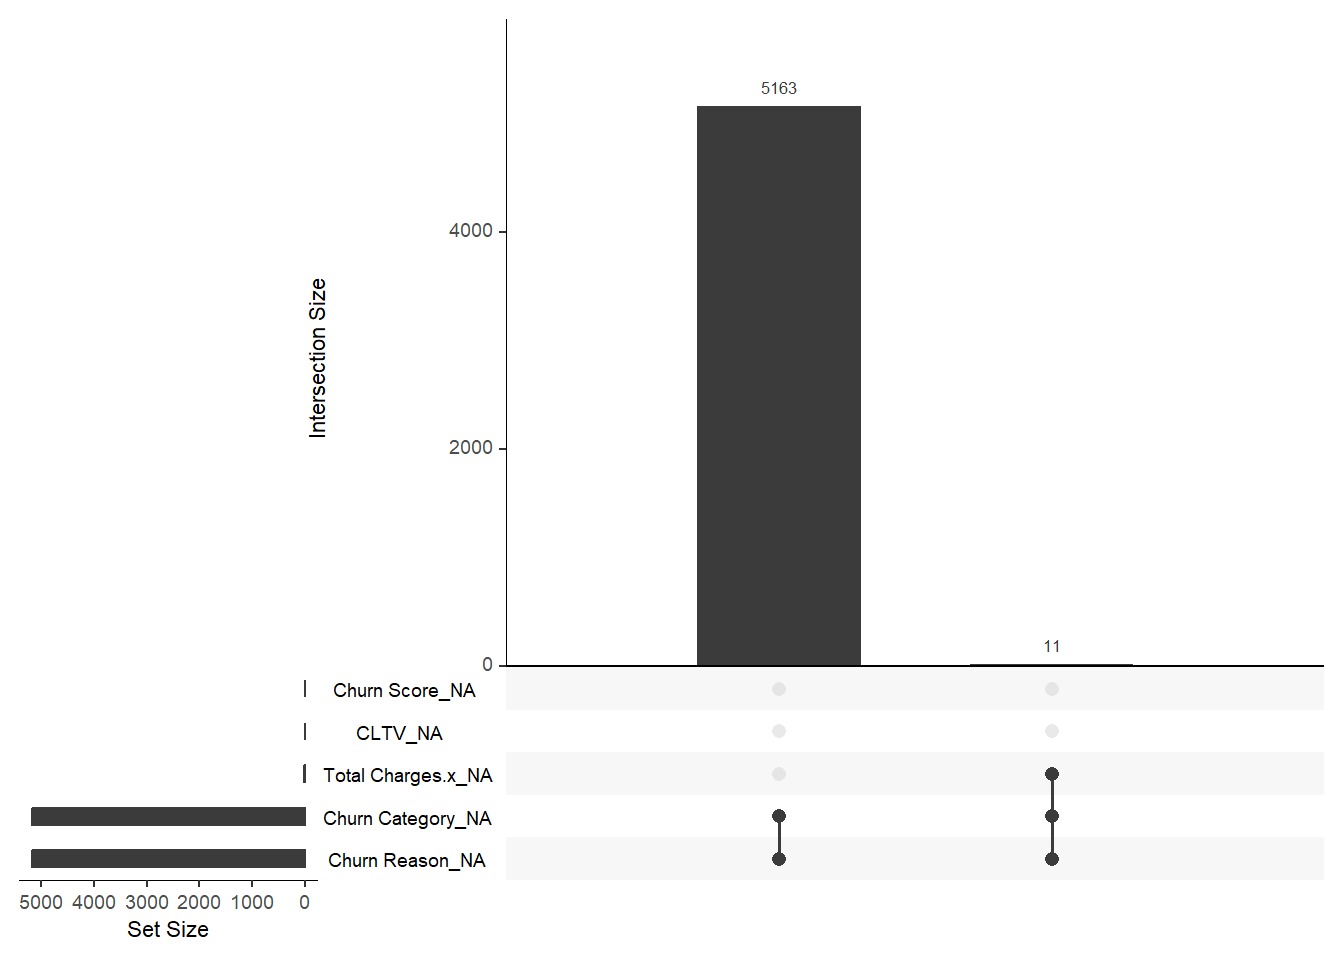
There are 5163 rows have 2 missing variables, specifically Churn Category and Churn Reason.
Only a very small subset of rows (11 rows) has multiple missing variables, specifically Churn Category, Churn Reason and Total Charges.